
Analyst Impact - Fidelity
InvesTments
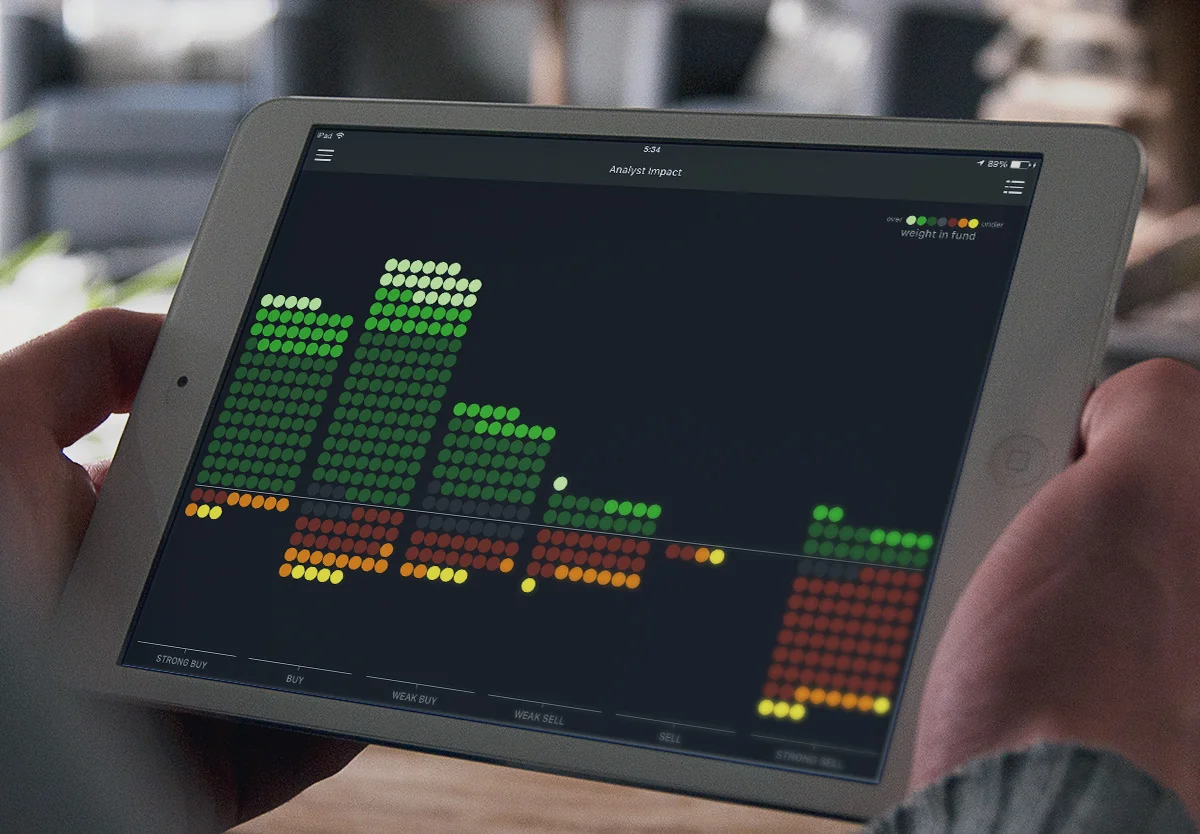
The Analyst Impact application provides Fidelity Investment analysts the ability to see the relationship between their research and the positions portfolio managers have taken with their covered security.
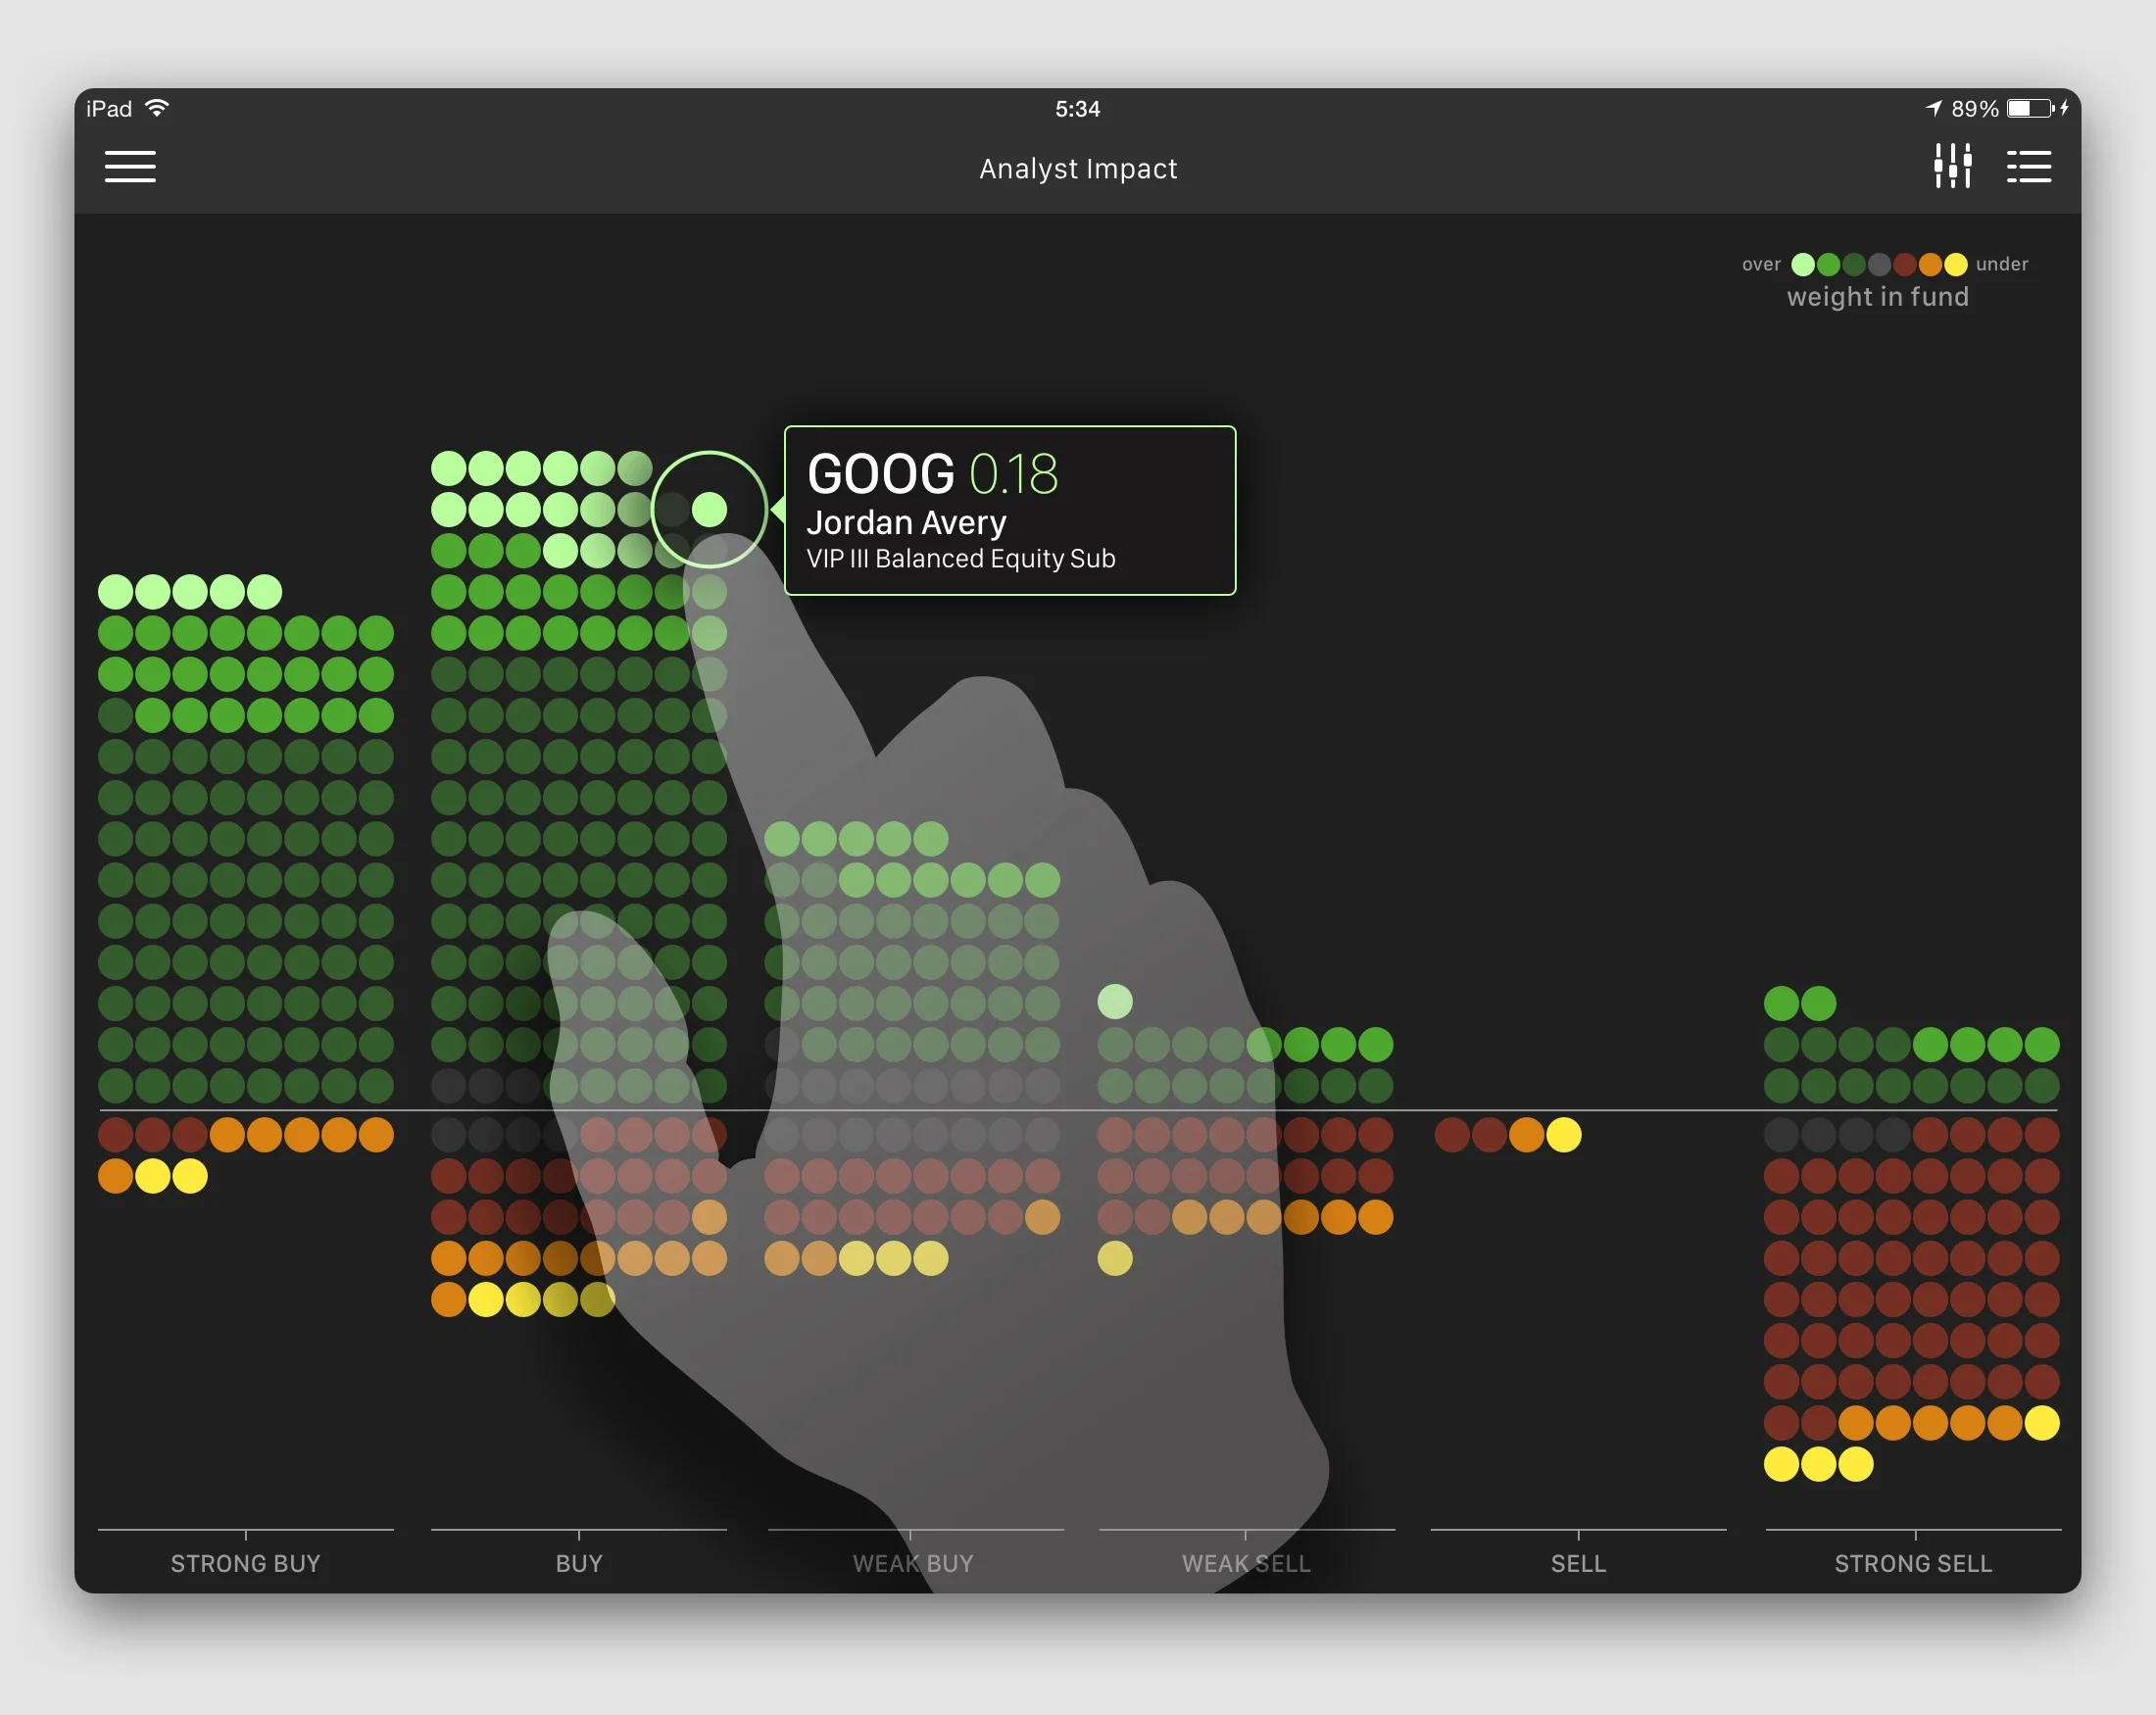
How can you design and structure these thousands of points of data, stacked in huge tables across multiple systems, to show analysts the impact their research is having on portfolio managers? My solution provides a single picture for these analysts. It helps them discover outliers and generates points of discussion and follow-up between analysts and portfolio managers.
• Please note that all data represented here is fake. I certainly wouldn't want you to make any financial decisions based off of these designs.